New diagram controlAdds new Diagram and Gantt controls.
Features
ASP.NET Controls
Common Enhancements
- Accessibility.
- Adaptivity.
- Data Filtering.
- Data Editing (including Batch Editing).
- Touch Support.
- Data Export.
- Validation.
New Diagram
- 40+ Customizable and Scalable Shapes (including OrgChart shapes).
- Collapsible Shape Containers.
- Custom Shapes.
- Straight and Right-Angle Diagram Connectors.
- Bind to any External Data Source.
- Load / Save Diagram in JSON.
- Export to SVG, PNG and JPEG.
- Auto Layout.
- Templates.
- Full Screen Mode and Simple View.
- Read-Only Mode.
- Configurable Page Settings.
- Customizable UI.
- Support for Mobile Devices.
- DevExpress Themes.
- Localization.
New Gantt
- Data Binding.
- Task, Dependency and Resource Management.
- Change History.
- Column Management.
- Data Sorting.
- Task Dependency and Parent/Child Relationship Validation.
- Time Highlighting.
- Context Menu and Toolbar.
- Scroll and Zoom.
- Work Time and Holidays.
- Configurable Task Appearance.
- Localization.
Performance Improvements
- The controls are now much faster within the Visual Studio designer.
- Page can be edited approximately 2-5 times faster.
- First page load speed has been improved by more than 25% for websites and more than doubled for Web Applications (based on page complexity).
- ListBox/Combobox can now manage thousands of items on the client-side up to 10 times faster.
- Controls that rely on SVG images are now rendered faster.
- GridView requires fewer database queries when filtering DateTime columns and exporting data in server mode (especially selected rows).
- Decreased the number MVC GridView deadlocks.
Data Grid (GridView) Enhancements
- New context menu commands allow you to generate summaries on the fly:
- COUNT, MIN and MAX summaries for Enum / DateTime / String columns;
- COUNT, MIN, MAX, SUM and AVG summaries for numeric columns.
- ASP.NET GridView's toolbar now offers batch editing commands.
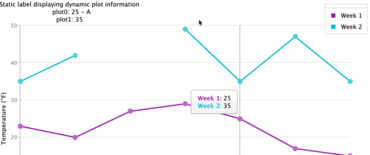
Charting
- Calculated Fields - This release includes calculated field support. Calculated fields allow you to apply an expression to data source fields.
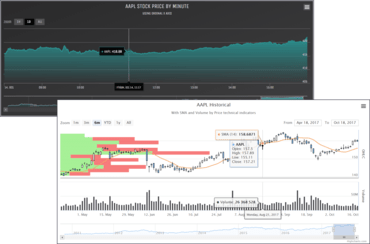
- New DateTime Axis Mode - v20.1 includes a new SkipRangesWithoutPoints option. Enable it to automatically exclude all axis ranges without data points. This feature is especially useful for financial charting - you no longer need to manually define non-working date intervals.
File Manager and Upload Control
- Support for SharePoint Cloud Provider - With this release, the ASP.NET File Manager control allows end-users to manage files stored on SharePoint's cloud service.
Pivot Grid
- New Filter Panel Mode - DevExpress ASP.NET Pivot Grid includes a new filter panel mode called Filter. In this mode, a filter applied in the Filter Editor is synchronized with field filters.
New Summary Types for Server Mode and 'Optimized' Client Mode
- New PivotGrid summary types include:
- CountDistinct.
- Median.
- Mode.
- The Expression editor ships with the following new functions:
- CountDistinct().
- Median().
- Mode().
Rich Text Editor
- Client-Side WYSIWYG Export to PDF - The Rich Text Editor can now export a document to PDF directly on the client. When a document is exported to PDF on the client, PDF layout mirrors the layout displayed within the browser.
- Font Management API - Improved the Rich Text Editor's font management API. You can now specify font information for both the Ribbon and all associated dialog windows in a single code location.
New API
- MVCxClientUtils.PerformValidationInContainer / MVCxClientUtils.PerformValidationInContainerById - Allow you to validate editors (including hidden) on a form.
- GetDataItem - Gets a specific item data object from a data source linked to list editors.
- GridViewSettings.DetailRowGetButtonVisibility - Allows you to control expand buttons visibility within individual data rows.
- TreeList.NodeCollapsing / TreeList.NodeExpanding event arguments now include an 'htmlEvent' parameter.
ASP.NET Core Controls
New Diagram
- 40+ Predefined Shapes (including collapsible shape containers and OrgChart shapes).
- Custom Shapes.
- Bind to External Data.
- Load / Save Diagram in the JSON Format.
- Export to SVG, PNG and JPEG.
- Auto Layout.
- Templates.
- Full Screen and Simple View Modes.
- Read-Only Mode.
- Configurable Page Settings.
- UI Customization.
- Support for Mobile Devices.
- Localization.
New File Manager
- Configurable and Modular File System Providers.
- File and Folder Editing.
- Upload / Download Files.
- Thumbnail and Details view modes.
- Selection.
- Progress and Status UI.
- Toolbar and Context Menu.
- File Upload Validation.
- Responsive UI.
- Touch Support.
- Localization.
New Gantt
- Data Binding.
- Task, Dependency and Resource Management.
- Change History.
- Task Dependency and Parent/Child Relationship Validation.
- Time Highlighting.
- Context Menu and Toolbar.
- Scroll and Zoom.
- Configurable Task Appearance.
- Localization.
Charting
- Custom Position of Chart Axes - You can now specify the X/Y offset for axes origin.
- Polar Chart Annotations - The Polar Chart now includes annotation support.
Data Grid
- New Export to Excel API
- Customize Individual Cells via customizeCell Callback.
- Column Band Export.
- Cell Text Alignment, Wrapping and Font Settings.
- DataGrid's Column Format Support.
- Cell Image Export.
- Excel-Inspired Column Filter.
Data Grid and Tree List
- Remote Validation Support - Extended Asynchronous Validation Rule support in DataGrid/TreeList cells when using row and batch edit modes.
Rich Text Editor
- Client-Side WYSIWYG Export to PDF - The Rich Text Editor can now export a document to PDF directly on the client. When a document is exported to PDF on the client, PDF layout mirrors the layout displayed within the browser.
- Font Management API - Improved the Rich Text Editor's font management API. You can now specify font information for both the Ribbon and all associated dialog windows in a single code location.
Scheduler
- Hourly Repeating Events - DevExtreme Scheduler can now use hours to specify repeat intervals for an event (such as an event that repeats every 4 hours).
- Adaptivity Enhancements - The DevExtreme Scheduler's Appointment Form was redesigned to better match screen size.
- API Enhancements - This release includes a new 'allowEditingTimeZones' option. You no longer need to implement a custom 'onAppointmentFormOpening' event handler.
HTML/Markdown Editor
- Multi-line Toolbar - You can now display HTMLEditor toolbar items across multiple lines. Turn-off the 'toolbar.multiline' option to disable this new option.
UI Widgets
- TreeView - Selection API Enhancements
- GetSelectedNodes - gets selected nodes.
- GetSelectedNodeKeys - gets selected node keys.
- TreeView - Scrolling API Enhancements
- The new 'scrollToItem' method allows you to scroll to a specified TreeView node.
Visual Studio Integration
- New DevExtreme-based ASP.NET Core Project Wizard - v20.1 ships with a fully reworked project wizard. Combined multiple ASP.NET Core project templates into a single new item. Once you create a project, the wizard will ask you to choose between:
- Two .NET Core LTS versions - 2.1 and 3.1. Note that 3.1 is only available in Visual Studio 2019.
- Razor Pages or MVC Views
- Bootstrap or Material application layout
- New Scaffold API Controller Wizard (XPO Data Model) - The new wizard allows you to create an API controller that uses an eXpress Persistent Objects (XPO) data model.
ASP.NET Bootstrap Controls
Accordion
- Group Appearance Options - New properties allow you to customize a group's appearance:
- SettingsBootstrap.RenderOption - specifies the Bootstrap style used for an Accordion group.
- TextCssClass - specifies CSS classes for a group's text.
GridView
- Edit Form Customization API - New server-side and client-side API allows you to customize the Edit Form. You can now specify item caption and toggle item visibility as needed.
Charting
- Custom Position of Chart Axes - You can now specify the X/Y offset for axes origin. Use the BootstrapChartCommonAxisSettings.CustomPosition and BootstrapChartCommonAxisSettings.Offset properties as necessary.
Editors
- List Box / ComboBox - Multi-Column Mode
- The Bootstrap List Box and ComboBox controls can now display data across multiple columns. Set the BootstrapListBox.EnableMultiColum / BootstrapComboBox.EnableMultiColum property to 'true' to enable multi-column mode.
- New field settings allow you to customize a column's caption, width and tooltip (SettingsMultiColumn).
FileManager
- Support for SharePoint Cloud Provider - With this release, the ASP.NET File Manager control allows end-users to manage files stored on SharePoint's cloud service.
- ListBox/Combobox can now manage thousands of items on the client-side up 10 times faster.
- GridView requires fewer database queries when filtering DateTime columns and exporting data in server mode (especially selected rows).